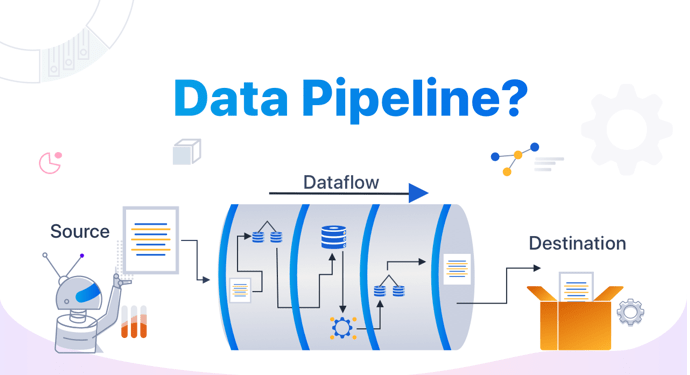
In general, data pipelines can
usually be divided into data ingestion, storage, processing, analysis, and
visualization. Let’s have a look at these processes.
Phases
of Data Integration:
Data
Ingestion:
Data ingestion is the process of introducing large,
diverse data files from multiple sources into a single, cloud-based storage
medium, a data warehouse, data mart, or database, where it can be retrieved and
investigated.
The ingestion process can be classified into two main
types: real-time ingestion and batch ingestion.
o
Real-time data ingestion is when data is ingested as it
occurs, and real-time data ingestion for analytical or transactional
processing enables businesses to make timely operational decisions that
are critical to the success of the organization, while the data is still
current. Transactional and operational data contain valuable insights that
drive informed and appropriate actions.
o
Batch data ingestion is when the information is collected over time and
then processed at once in the form of a single batch or chunks at regular
intervals. With streaming ingestion, the data is processed and created.
Data
Storage:
Once data is ingested, it needs to be stored in a
central storehouse. Data storage choices have grown over the years but the most
common choices include the data warehouses and data lakes. Some of the popular
technologies used for data storage are Hadoop, Amazon
S3, and Google
BigQuery.
Data
Processing:
After the data is moved
into the storage warehouse or storehouse, the process of cleaning,
transforming, and enhancing the data takes place in the data processing stage.
The processes implemented here help to make the incoming data usable for
analysis. The most common tools used for data processing include platforms such
as Apache Spark, Apache Beam, or Apache Flink.
Data
Analysis:
Data analysis is a process for obtaining raw data
from different sources, and subsequently converting it into information useful
for decision-making by users. The data is collected and analyzed to answer
questions, test hypotheses, or negate theories. The
most popular tools used for data analysis are languages like SQL, Python, or R.
Data
Visualization:
Data visualization is the visual illustration of data through the use of common graphics, such as charts, plots, infographics, and even simulations or animations. The analyzed data may be shown in visual form. These visual displays of information communicate complex data relationships and data-driven insights in a way that is easy to understand. Typically, dashboards, charts, or graphs are used to display data. Tools for visualizing data that are widely used include Tableau, Power BI, and QlikView.
What is ETL?
ETL
(Extract, Transform, Load):
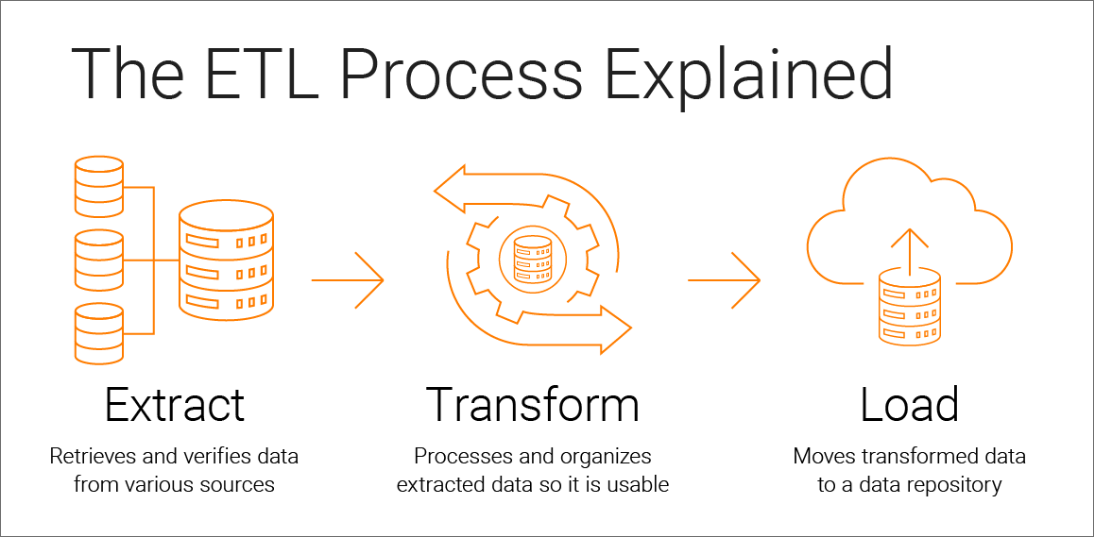
ETL is the technological term for the data integration process that combines data from multiple data sources into a single, consistent data store that is loaded into a data warehouse or other target system. ETL is the traditional approach to data integration. In ETL, data is extracted from source systems, transformed into a consistent format, and then loaded into a data warehouse or another target system. This transformation typically occurs in a dedicated ETL server or engine before the data reaches its final destination. ETL is widely used when data quality and consistency are critical, and when source data needs to be cleansed, enriched, or aggregated before it's available for analysis.
ELT
(Extract, Load, Transform):
Basic data pipelines include a series of steps that
transfer data from a source to a destination, where it is received in a
preprocessed or reformed condition. A slightly different strategy is used by an
ELT pipeline (Extract, Load,
Transform), which uses different technologies and performs some of the activities
in a different order.
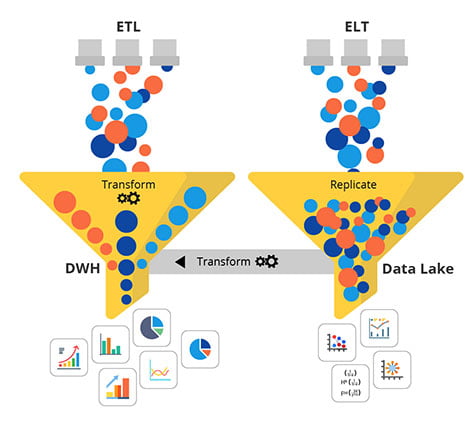
The capacity to handle massive volumes of data quickly and effectively is the main advantage of utilizing an ELT pipeline. An ELT pipeline, unlike the basic pipeline techniques, extracts the data and puts it into a target data store before converting it. This strategy has the advantage of allowing for quicker data intake while reducing the strain on the source systems. The transformation phase procedures can then be carried out using the target data store once the data has moved from the source to the target in its raw form. Depending on the platform, it can simply modify the data using SQL, Python, or R since the target data repository is frequently a data warehouse or data lake.
Key
Differences between the Two Pipelines:
o
Data
Volume and Processing Power:
·
ETL
works best with low to medium-sized data quantities since it can handle
transformations on a dedicated ETL server in an efficient manner.
·
Because
ELT makes use of the scalable processing power of cloud-based systems like AWS,
Azure, or Google Cloud, it performs very well when working with enormous
datasets.
o
Data
Transformation Timing and Quality:
·
ETL
transforms data before loading it into the target system, ensuring high data
quality but potentially increasing the time to insight.
·
ELT
loads data first and transforms it later, providing faster data ingestion but
potentially requiring downstream processes to handle varying data quality.
o
Data
Warehouse vs. Data Lake:
·
ETL
typically loads data into a data warehouse, which enforces structure and schema
on the data.
·
ELT
loads data into a data lake or cloud-based storage, allowing for more
flexibility and agility in handling unstructured or semi-structured data.
o Complexity and Skill Requirements:
·
ETL
may require specialized ETL tools and expertise for designing and managing the
transformation processes.
· ELT simplifies the process by using the computing power of cloud platforms and the familiarity of SQL for transformations, making it more accessible to data engineers and analysts.
Summary:
ETL and ELT are essential components of modern data pipelines, each with its strengths and use cases. The choice between them depends on factors like data volume, data quality requirements, and infrastructure. Whichever approach you select, it's vital to prioritize data quality, performance, security, and scalability to ensure your data pipelines are efficient and reliable. By following best practices, you can streamline your data processes and harness the power of data for informed decision-making in your organization.

Dot Labs is an IT
outsourcing firm that offers a range of services, including software
development, quality assurance, and data analytics. With a team of skilled
professionals, Dot Labs offers nearshoring services to companies in North
America, providing cost savings while ensuring effective communication and
collaboration.
Visit our website: www.dotlabs.ai, for more information on how Dot
Labs can help your business with its IT outsourcing needs.
For more informative
Blogs on the latest technologies and trends click
here


